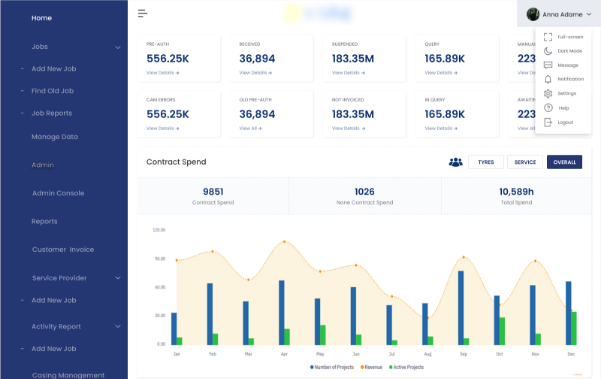
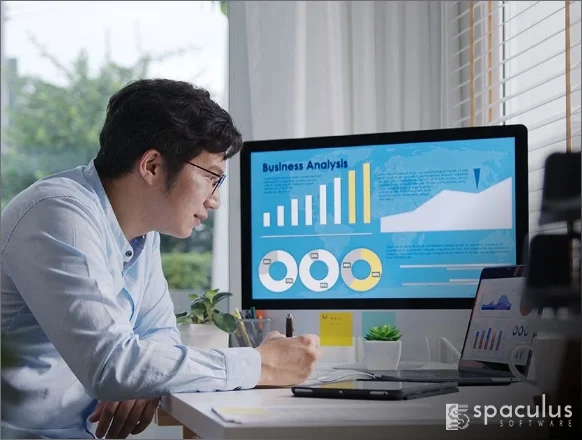
Data Visualization is the process of representing data and information in a visual format, such as charts, graphs, maps, and dashboards. It helps transform complex datasets into easy-to-understand visuals, enabling businesses and individuals to quickly grasp insights, identify patterns, and make informed decisions.


We help financial institutions unlock insights from large volumes of transactional and operational data. Our dashboards support better risk management, fraud detection, and investment decision-making.
From claims processing to customer segmentation, we bring clarity to complex insurance datasets. Our solutions make it easier to detect anomalies, assess risk, and forecast premiums.
We enable manufacturers to visualize plant operations, equipment performance, and production trends. This leads to faster decisions, reduced downtime, and optimized resource allocation.
For logistics companies, we turn real-time movement, delivery, and route data into actionable dashboards. This improves delivery timelines, reduces costs, and boosts customer satisfaction.
We help brands analyze customer behavior, sales trends, and marketing effectiveness. Our dashboards support inventory planning, conversion tracking, and campaign performance in one place.
From patient records to operational data, we build visuals that support faster diagnosis, better care coordination, and improved compliance.
We help hotels and resorts analyze booking trends, guest preferences, and service performance. These insights guide pricing, marketing, and guest experience improvements.
Track product performance, returns, and customer feedback in real time. Our dashboards help electronics brands optimize product development, support, and market targeting.
We support fast-growing startups with lean, scalable dashboards that track growth metrics, funding use, and customer engagement—all in real time.

Proficient in applying various visualization techniques to deliver clear and insightful data representations.

Specialized BI solutions crafted to align with your specific business needs and objectives.

Expertise in handling complex datasets with precision, delivering meaningful and actionable insights.

Designing intuitive interfaces that enhance user experience, ensuring seamless interaction and clear data interpretation.

Developing interactive dashboards that enable seamless data exploration and instant decision-making.

Dedicated to adopting the latest trends and technologies to deliver innovative and impactful visualization solutions.
Analyzing complex data can be challenging, but interactive visual representations simplify interpretation and decision-making.

An expert contacts you after having analyzed your requirements;
If needed, we sign an NDA to ensure the highest privacy level;
We submit a comprehensive project proposal with estimates, timelines, CVs, etc.
Data visualization helps in presenting complex data in a graphical or visual format, aiding in better understanding, analysis, and decision-making for businesses. It provides insights that might not be apparent in raw data, enabling more informed strategies.
Data analytics involves the process of examining datasets to derive conclusions, while data visualization focuses on presenting these analytical findings visually through graphs, charts, or dashboards.
Popular tools for data visualization and analytics include Tableau, Power BI, QlikView, Google Data Studio, and Python libraries such as Matplotlib and Seaborn for visualization, while analytics tools like R, Python, and SAS are widely used for data analysis.
Data visualization makes information more accessible and understandable, enabling decision-makers to comprehend trends, correlations, and patterns more intuitively. It aids in quicker and more accurate decision-making by presenting insights in a visual and easily digestible format.
Implementing data analytics and visualization drives innovation, enhances operational efficiency, improves customer experiences, helps in predictive analysis, fosters data-driven strategies, and allows for better market understanding and competitiveness across various industries.
