Fleet Management Performance Dashboard

Easily monitor job progress, identify delays, and make faster decisions with real-time insights from your fleet operations.

Get a FREE Consultation

Fleet Management Performance Dashboard

We built a clean, easy-to-use dashboard for a UK-based fleet and tyre management company. They wanted a faster way to track jobs, monitor vehicle status, and get useful insights without depending on tech support. Their goal was simple: let anyone on the team see what’s going on—job updates, delays, trends—without waiting for reports or writing any queries. So we used AWS QuickSight along with SPICE to build a system that runs fast, updates daily, and works straight out of the box. Now, their teams can make quicker decisions, spot problems early, and stay in sync—all from one place.

+

image

Key Challenges and Solutions

No real-time job tracking

  • We built a live dashboard that shows job statuses instantly. It updates every day without manual input, so teams can see progress in real time and avoid delays.

Too dependent on tech team

  • The dashboard uses dropdown filters that anyone can use. No need to ask developers or write code—team members can find what they need on their own.

Manual reporting was too slow

  • We used in-memory data processing to make dashboards load fast. Reports now update automatically each day, cutting report time by over 70%.

No way to forecast issues

  • We added AI-powered forecasts and pattern detection. Now, the system highlights upcoming spikes or drops, so managers can act early and avoid problems.

Key Functions That Keep Fleet Teams Moving

Live Job Tracking

The dashboard allows teams to track every job as it moves through different stages — pending, completed, invoiced, suspended, or under review. Before, teams had to wait for manual reports or ask someone in operations for updates. Now, everyone has access to real-time data. This means less time spent checking in with others, fewer missed jobs, and quicker decision-making when something goes off track. Whether it’s the field team or management, users can simply log in and see what’s happening without delay. This has improved day-to-day coordination across teams and helped avoid repeated follow-ups.

  • View job status anytime, anywhere
  • Avoid missed deadlines and delays
  • Keeps all teams on the same page
  • Saves time on daily coordination

Smart Forecasting for Job Load

We added built-in forecasting to help the company see what’s coming. Based on past job volumes, seasonality, and workload history, the dashboard gives an idea of what to expect next week or month. This allows managers to plan staffing, routes, and resources more accurately. No more guessing or overcommitting the team. When the system detects a pattern like a sudden increase or drop in job volume, it flags it early. The result? Better preparation, less last-minute scrambling, and fewer errors under pressure.

  • Forecasts job spikes and slow periods
  • Helps in better team scheduling
  • Reduces workload bottlenecks
  • Gives clear data for planning ahead

Fast Dashboard Performance (SPICE Engine)

Fleet operations generate thousands of records every day. Traditional tools lag or freeze when loading large datasets. That’s where SPICE comes in. It stores data in memory, so everything loads instantly—even when filters or searches are applied. Managers don’t have to wait minutes to see reports. Whether you’re checking 10 jobs or 10,000, the speed remains the same. This smooth performance saves time, avoids frustration, and lets teams act faster. It also keeps the system reliable during peak hours or when accessed by many users.

  • Loads thousands of records in seconds
  • No system crashes or long waits
  • Great for high-volume data access
  • Keeps dashboard performance smooth

Easy Data Filtering

Different users care about different data. Some need to filter by region, others by job type or vehicle category. So we added custom filters that are simple to use—just a few clicks. No code. No confusion. This means every user can find the exact data they care about without needing help from IT or developers. It also cuts down on back-and-forth between teams asking for custom reports.

  • Filters for date, job type, status, and more
  • Works without technical skills
  • Speeds up data access for everyone
  • Personalized insights for different users

Role-Based Access Control

Not everyone should see everything. That’s why the dashboard has role-based permissions. A field executive sees job progress. A manager sees team performance. A finance lead sees invoice data. Everyone gets the view they need—nothing more, nothing less. This keeps sensitive data safe and reduces clutter. It also gives every team a focused experience.

  • Custom views for each role
  • Keeps data secure and private
  • Avoids confusion and overload
  • Makes the system easy to use

Fully Embedded Inside Existing System

We didn’t build a new tool with a separate login. The dashboard was embedded inside the system the teams already use daily. That means no extra steps or switching screens. The experience feels natural, like a built-in feature. This boosted adoption and ensured that even non-technical staff use the dashboard regularly.

  • No extra tools to manage
  • Fits into current daily workflow
  • Increases user adoption
  • No new training needed

Daily Auto-Refresh

Every day, the system pulls new data from the database and updates all reports automatically. Users no longer wait for someone to generate a new file or email. It’s always ready. This ensures data is always fresh, accurate, and ready when needed—especially during busy operations.

  • Dashboard updates automatically every day
  • No delays or manual refreshes
  • Users always work with latest info
  • Reduces reporting workload for IT

Predictive Trends & Visuals

Data isn't just about numbers—it’s about patterns. The dashboard highlights unexpected changes, rising delays, or improving timelines through simple graphs. AI adds context by detecting anomalies or trends the human eye might miss. Users can act fast when they notice something off. And they can explain decisions clearly using visual proof.

  • Clean charts and trend lines
  • Highlights spikes or slowdowns
  • Detects outliers using AI
  • Helps explain performance shifts easily

No More Manual Reporting

Before, pulling a weekly or monthly report meant exporting Excel files, running formulas, and emailing it across teams. Now it’s automated. The dashboard handles the reporting logic and refreshes itself. This saved hours every week for the operations team. They now spend more time improving processes and less time compiling sheets.

  • Reports are automated, not manual
  • Reduces human errors
  • Saves hours every week
  • Teams focus on action, not admin

Scalable Cloud Infrastructure

As the company grows, so does the data. The system was built using scalable cloud tools to ensure it won’t slow down—even as the number of jobs, users, or reports increases. It’s future-ready, cost-efficient, and doesn’t need server maintenance from the client’s side.

  • Grows with the business
  • No slowdown with more users or data
  • No local server maintenance
  • Built for long-term use

The dashboard allows teams to track every job as it moves through different stages — pending, completed, invoiced, suspended, or under review. Before, teams had to wait for manual reports or ask someone in operations for updates. Now, everyone has access to real-time data. This means less time spent checking in with others, fewer missed jobs, and quicker decision-making when something goes off track. Whether it’s the field team or management, users can simply log in and see what’s happening without delay. This has improved day-to-day coordination across teams and helped avoid repeated follow-ups.

  • View job status anytime, anywhere
  • Avoid missed deadlines and delays
  • Keeps all teams on the same page
  • Saves time on daily coordination

We added built-in forecasting to help the company see what’s coming. Based on past job volumes, seasonality, and workload history, the dashboard gives an idea of what to expect next week or month. This allows managers to plan staffing, routes, and resources more accurately. No more guessing or overcommitting the team. When the system detects a pattern like a sudden increase or drop in job volume, it flags it early. The result? Better preparation, less last-minute scrambling, and fewer errors under pressure.

  • Forecasts job spikes and slow periods
  • Helps in better team scheduling
  • Reduces workload bottlenecks
  • Gives clear data for planning ahead

Fleet operations generate thousands of records every day. Traditional tools lag or freeze when loading large datasets. That’s where SPICE comes in. It stores data in memory, so everything loads instantly—even when filters or searches are applied. Managers don’t have to wait minutes to see reports. Whether you’re checking 10 jobs or 10,000, the speed remains the same. This smooth performance saves time, avoids frustration, and lets teams act faster. It also keeps the system reliable during peak hours or when accessed by many users.

  • Loads thousands of records in seconds
  • No system crashes or long waits
  • Great for high-volume data access
  • Keeps dashboard performance smooth

Different users care about different data. Some need to filter by region, others by job type or vehicle category. So we added custom filters that are simple to use—just a few clicks. No code. No confusion. This means every user can find the exact data they care about without needing help from IT or developers. It also cuts down on back-and-forth between teams asking for custom reports.

  • Filters for date, job type, status, and more
  • Works without technical skills
  • Speeds up data access for everyone
  • Personalized insights for different users

Not everyone should see everything. That’s why the dashboard has role-based permissions. A field executive sees job progress. A manager sees team performance. A finance lead sees invoice data. Everyone gets the view they need—nothing more, nothing less. This keeps sensitive data safe and reduces clutter. It also gives every team a focused experience.

  • Custom views for each role
  • Keeps data secure and private
  • Avoids confusion and overload
  • Makes the system easy to use

We didn’t build a new tool with a separate login. The dashboard was embedded inside the system the teams already use daily. That means no extra steps or switching screens. The experience feels natural, like a built-in feature. This boosted adoption and ensured that even non-technical staff use the dashboard regularly.

  • No extra tools to manage
  • Fits into current daily workflow
  • Increases user adoption
  • No new training needed

Every day, the system pulls new data from the database and updates all reports automatically. Users no longer wait for someone to generate a new file or email. It’s always ready. This ensures data is always fresh, accurate, and ready when needed—especially during busy operations.

  • Dashboard updates automatically every day
  • No delays or manual refreshes
  • Users always work with latest info
  • Reduces reporting workload for IT

Data isn't just about numbers—it’s about patterns. The dashboard highlights unexpected changes, rising delays, or improving timelines through simple graphs. AI adds context by detecting anomalies or trends the human eye might miss. Users can act fast when they notice something off. And they can explain decisions clearly using visual proof.

  • Clean charts and trend lines
  • Highlights spikes or slowdowns
  • Detects outliers using AI
  • Helps explain performance shifts easily

Before, pulling a weekly or monthly report meant exporting Excel files, running formulas, and emailing it across teams. Now it’s automated. The dashboard handles the reporting logic and refreshes itself. This saved hours every week for the operations team. They now spend more time improving processes and less time compiling sheets.

  • Reports are automated, not manual
  • Reduces human errors
  • Saves hours every week
  • Teams focus on action, not admin

As the company grows, so does the data. The system was built using scalable cloud tools to ensure it won’t slow down—even as the number of jobs, users, or reports increases. It’s future-ready, cost-efficient, and doesn’t need server maintenance from the client’s side.

  • Grows with the business
  • No slowdown with more users or data
  • No local server maintenance
  • Built for long-term use

Overview

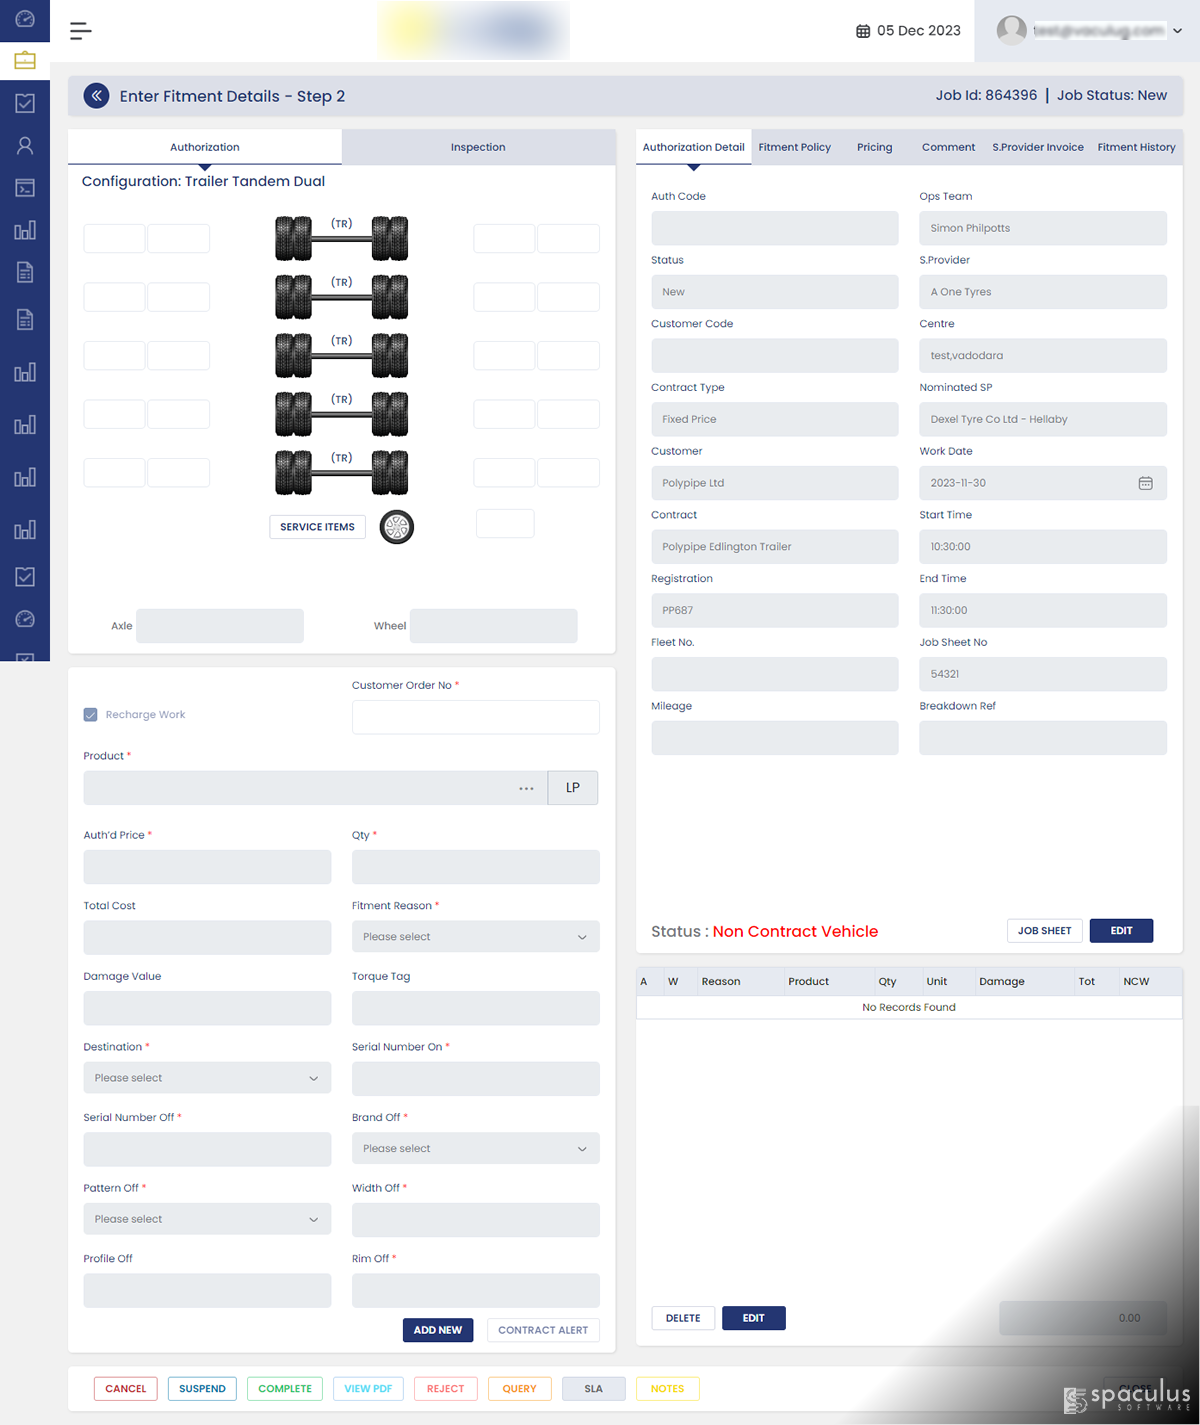
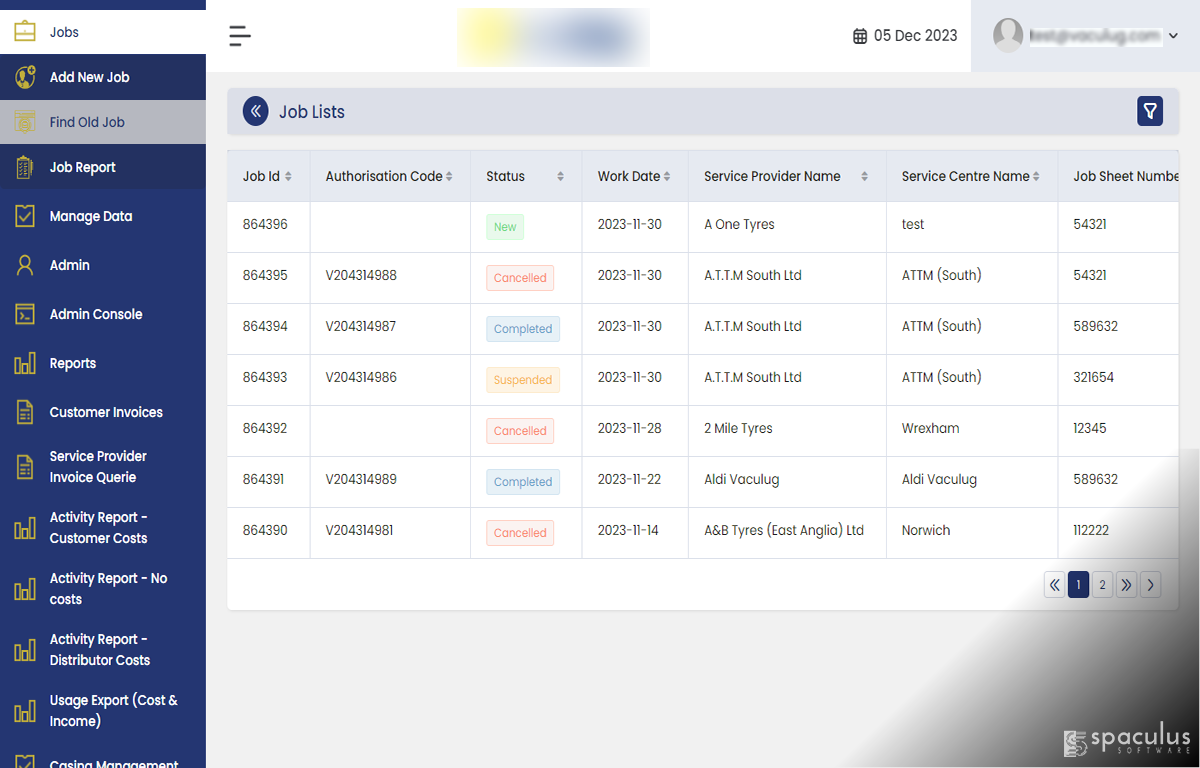
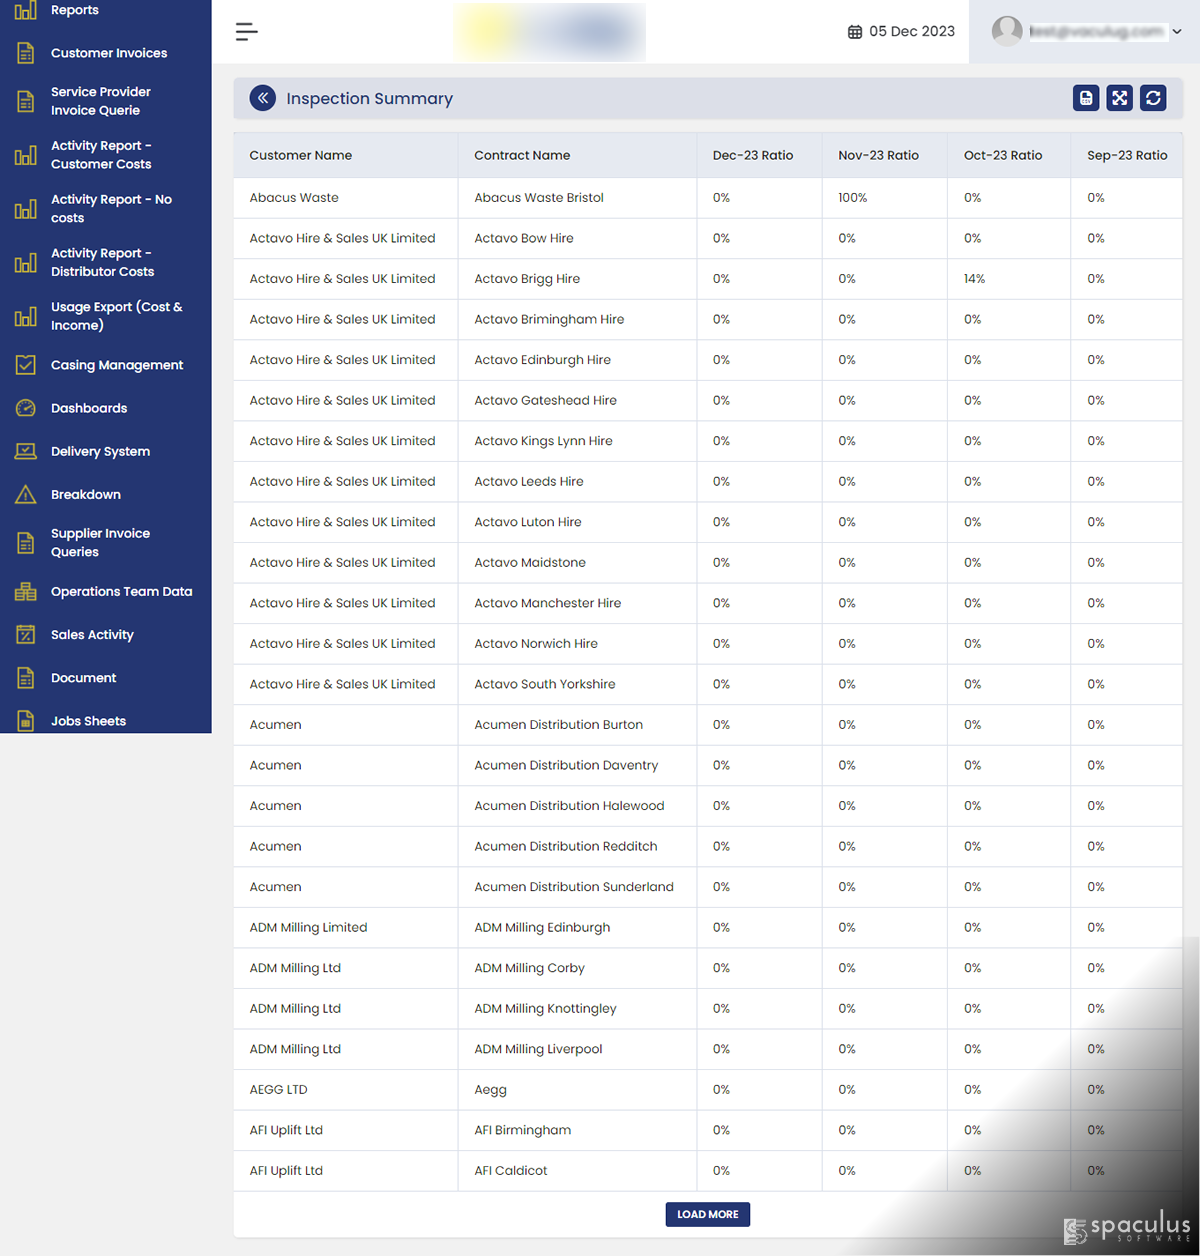
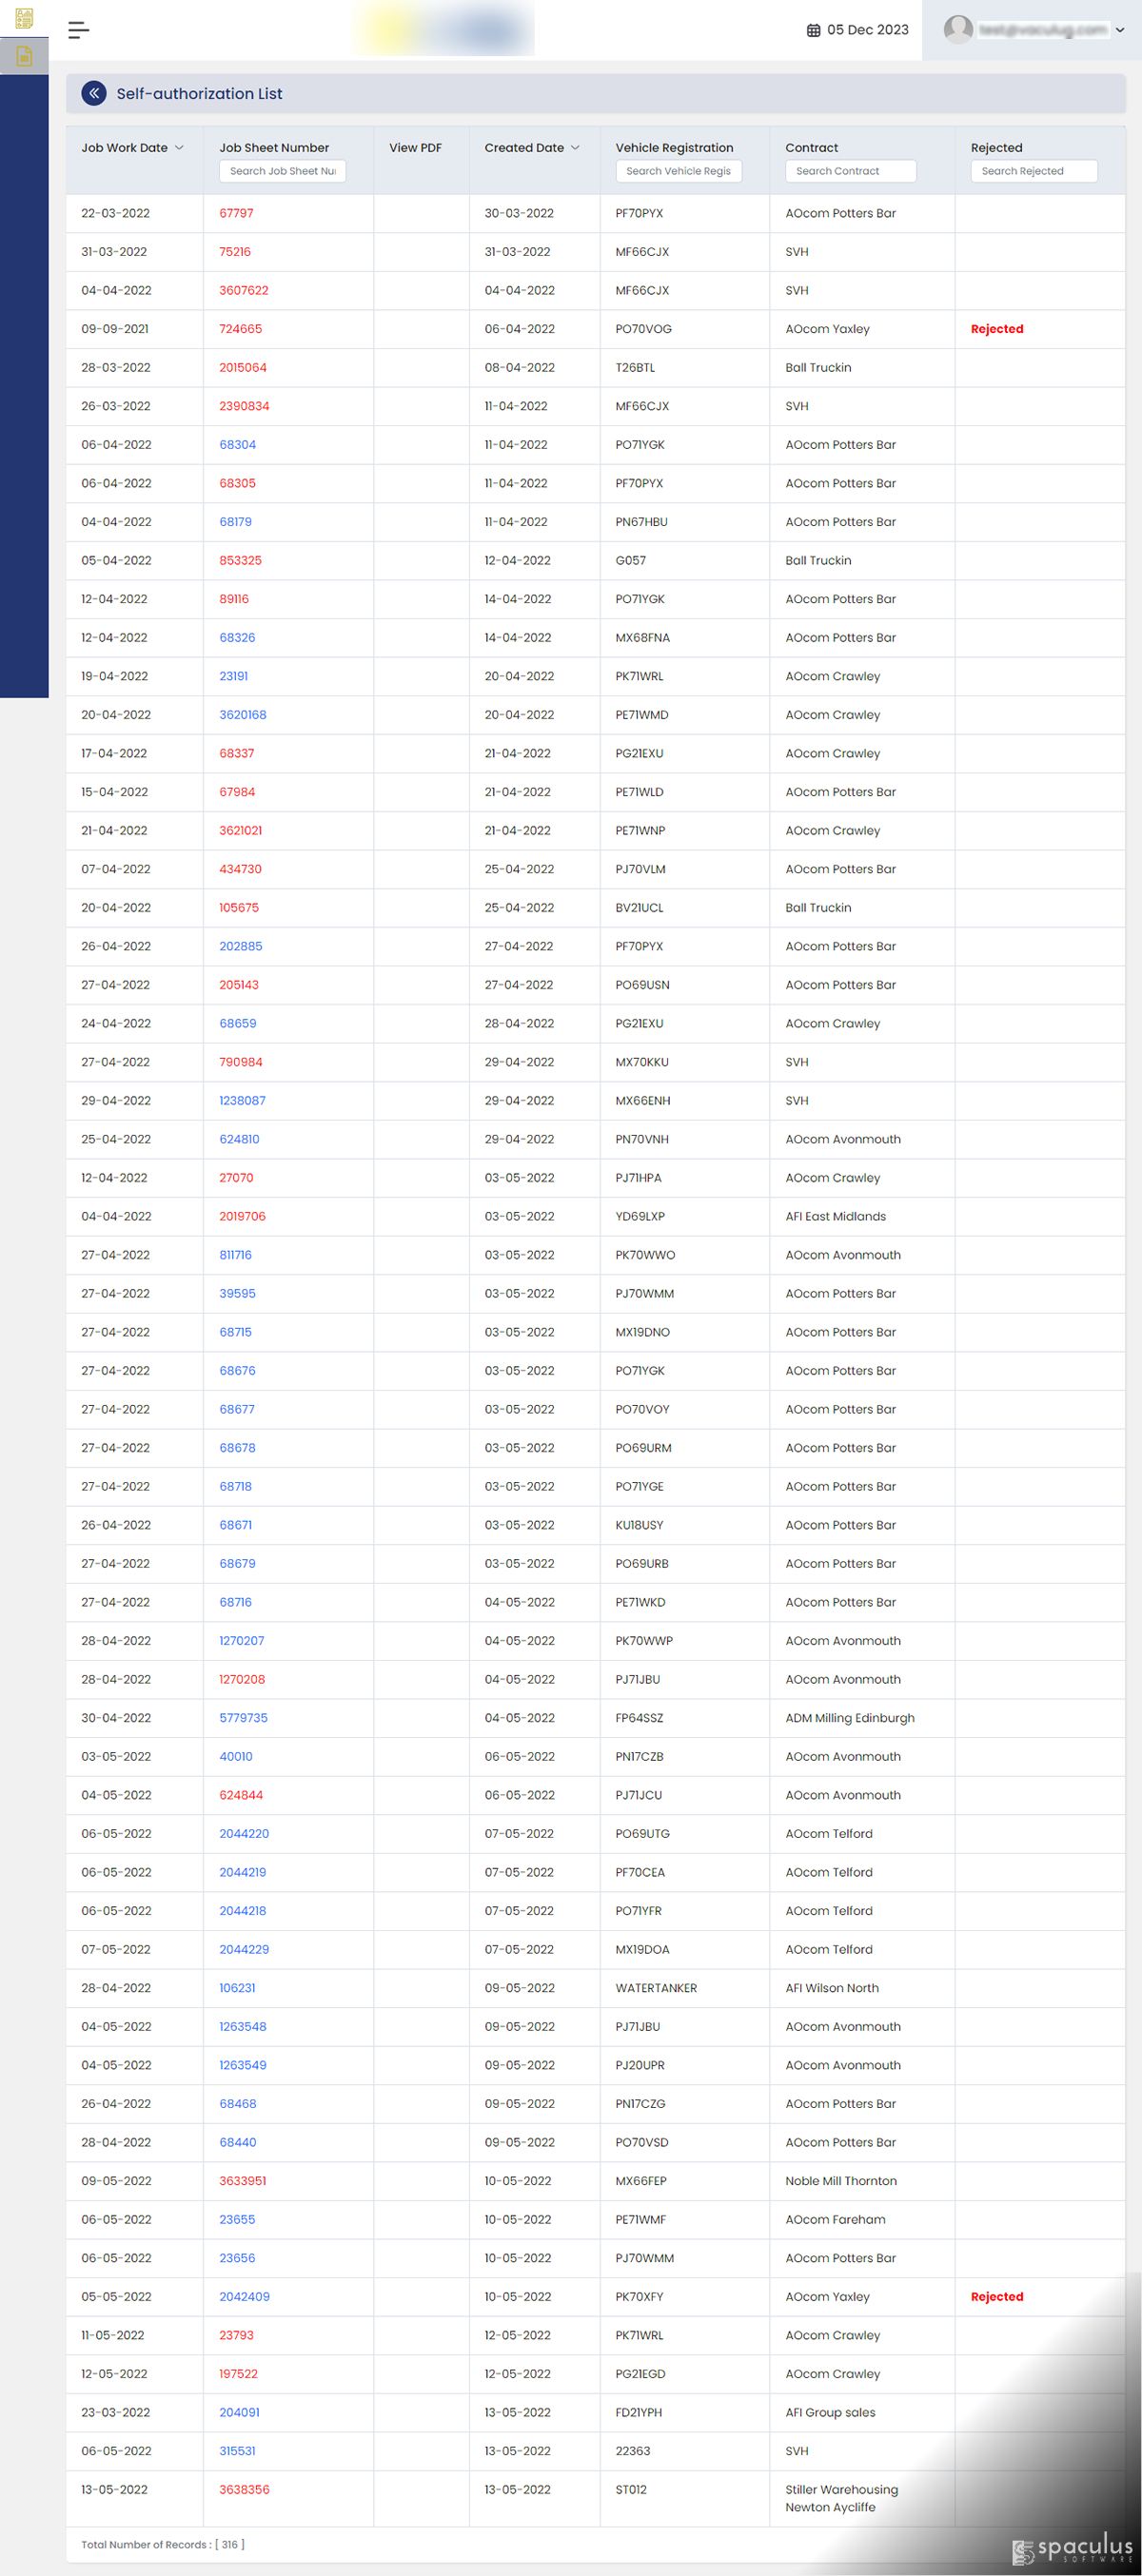
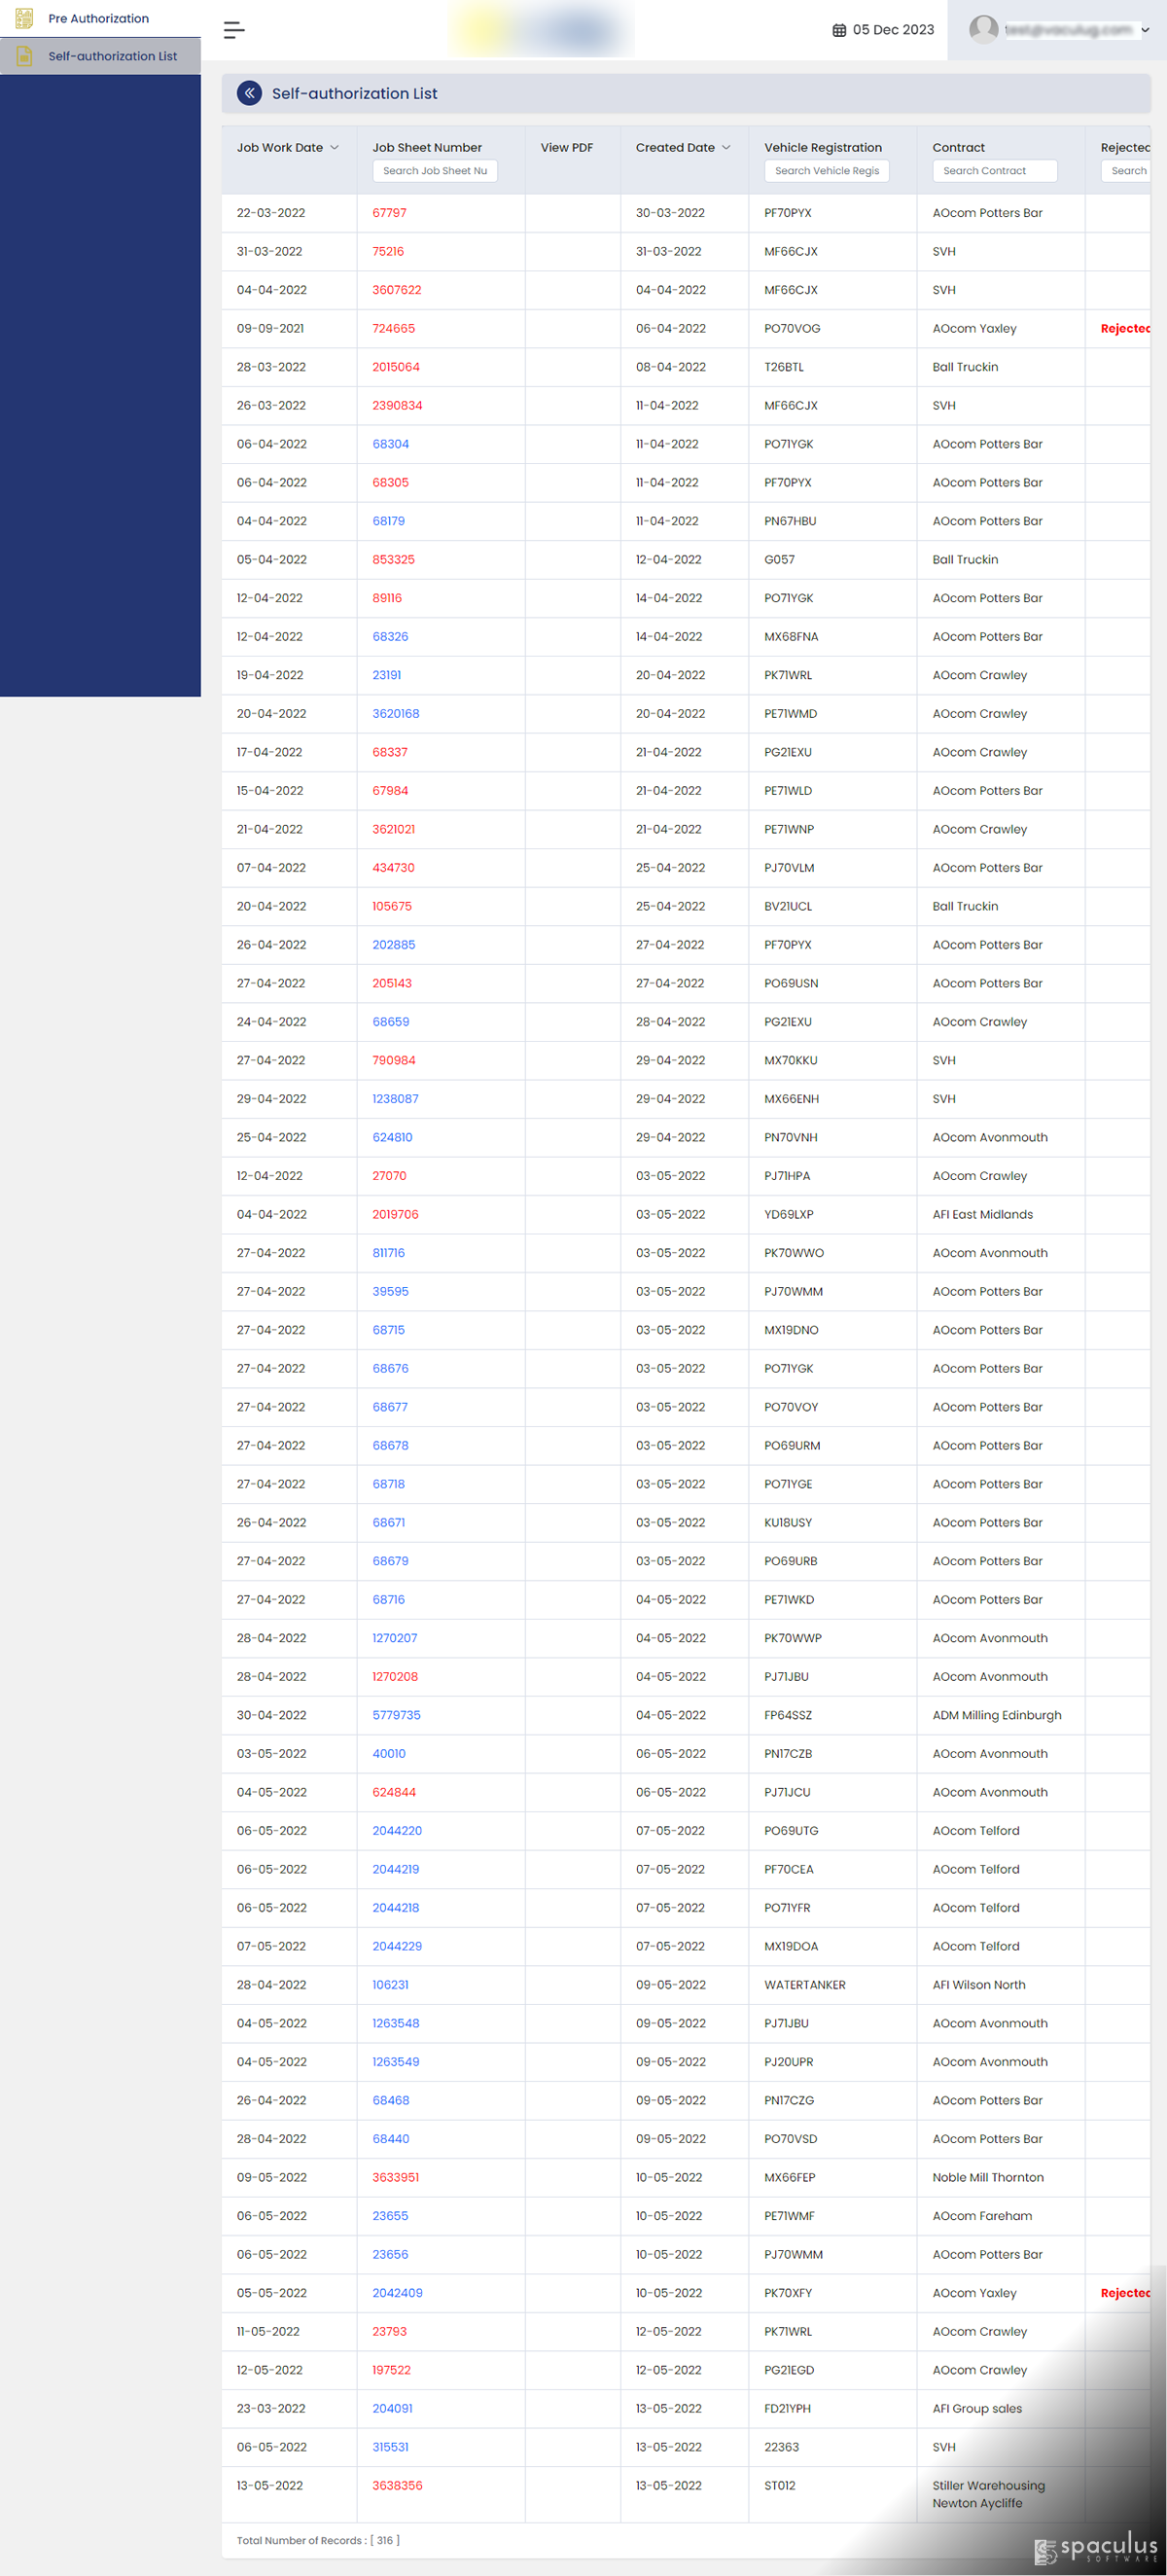
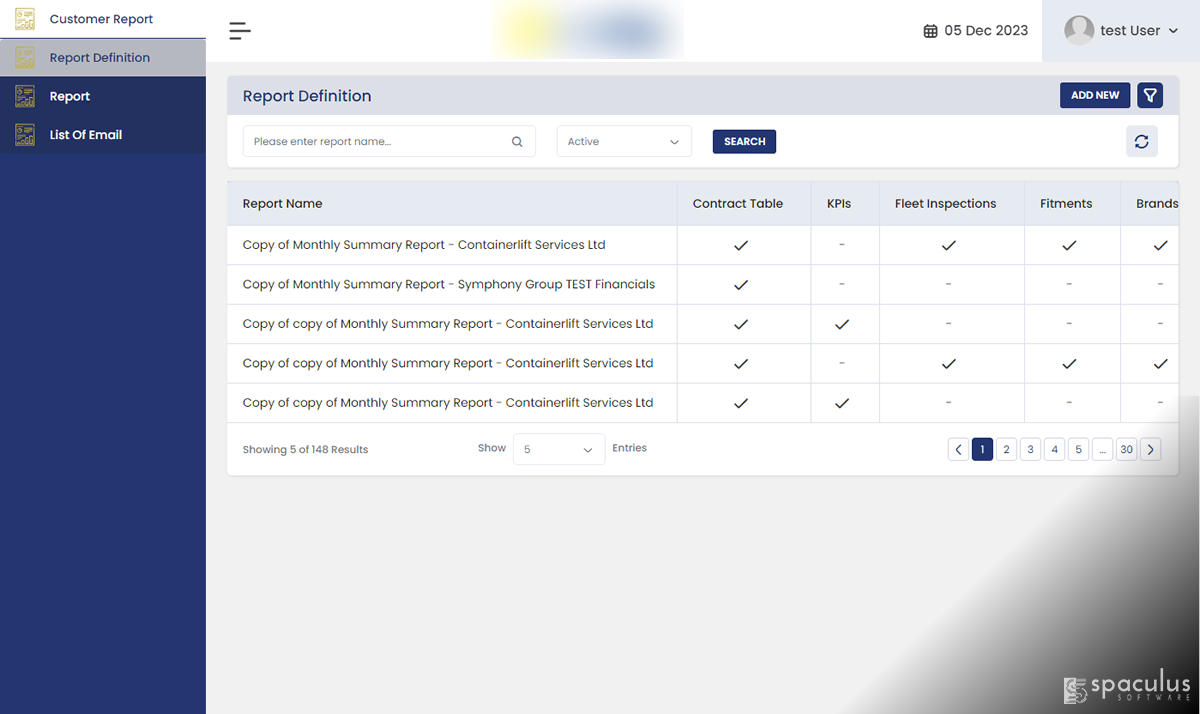
The goal was simple — give a fleet and tyre management company better control over their daily operations by turning job data into something useful. They had thousands of records coming in every day, but their teams couldn’t see updates fast enough or make quick decisions without waiting on reports.

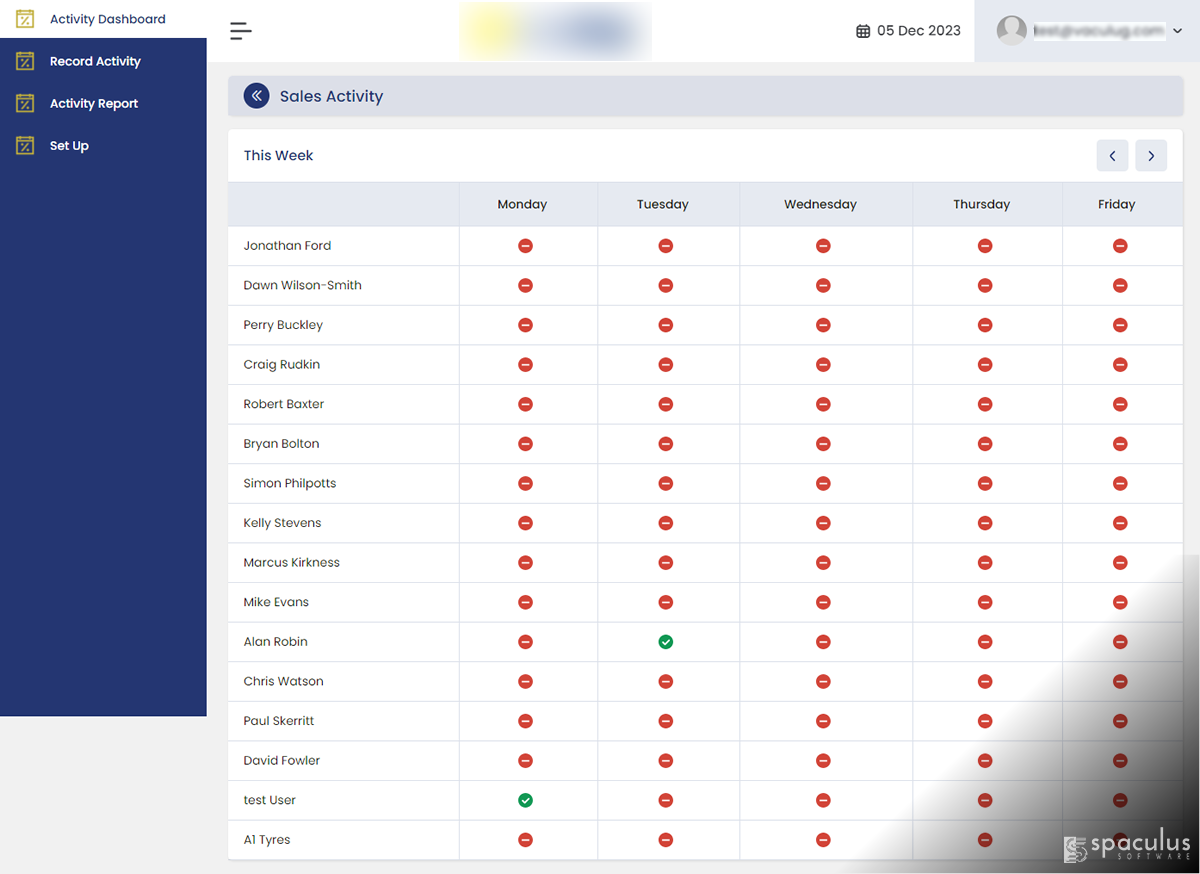
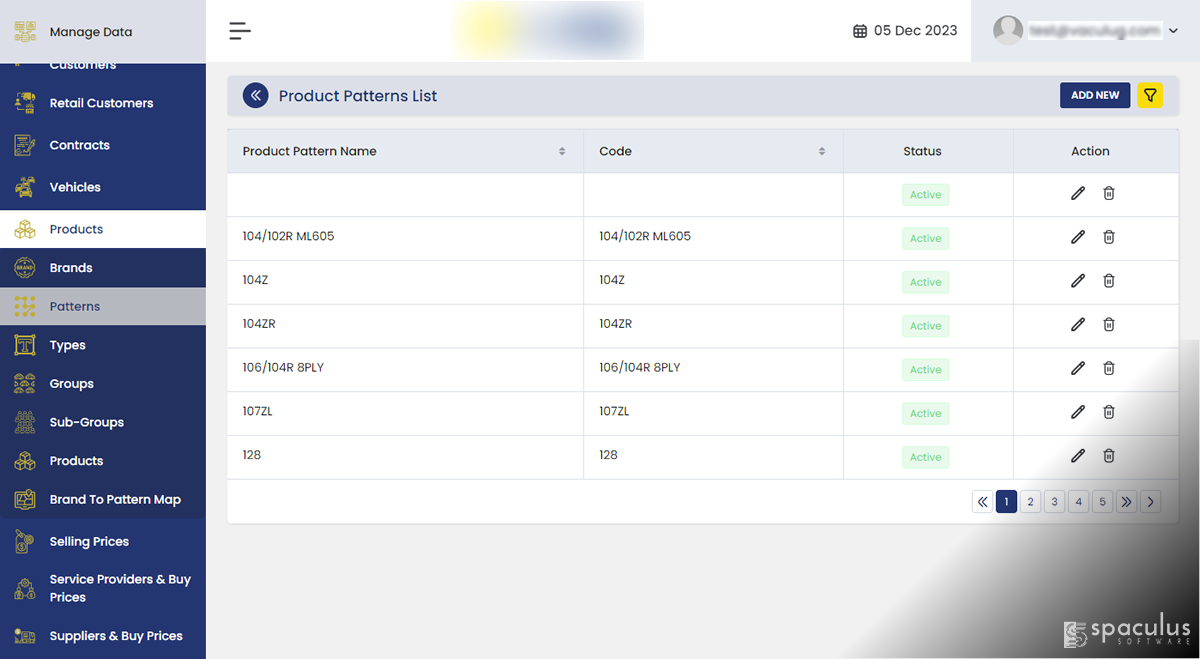
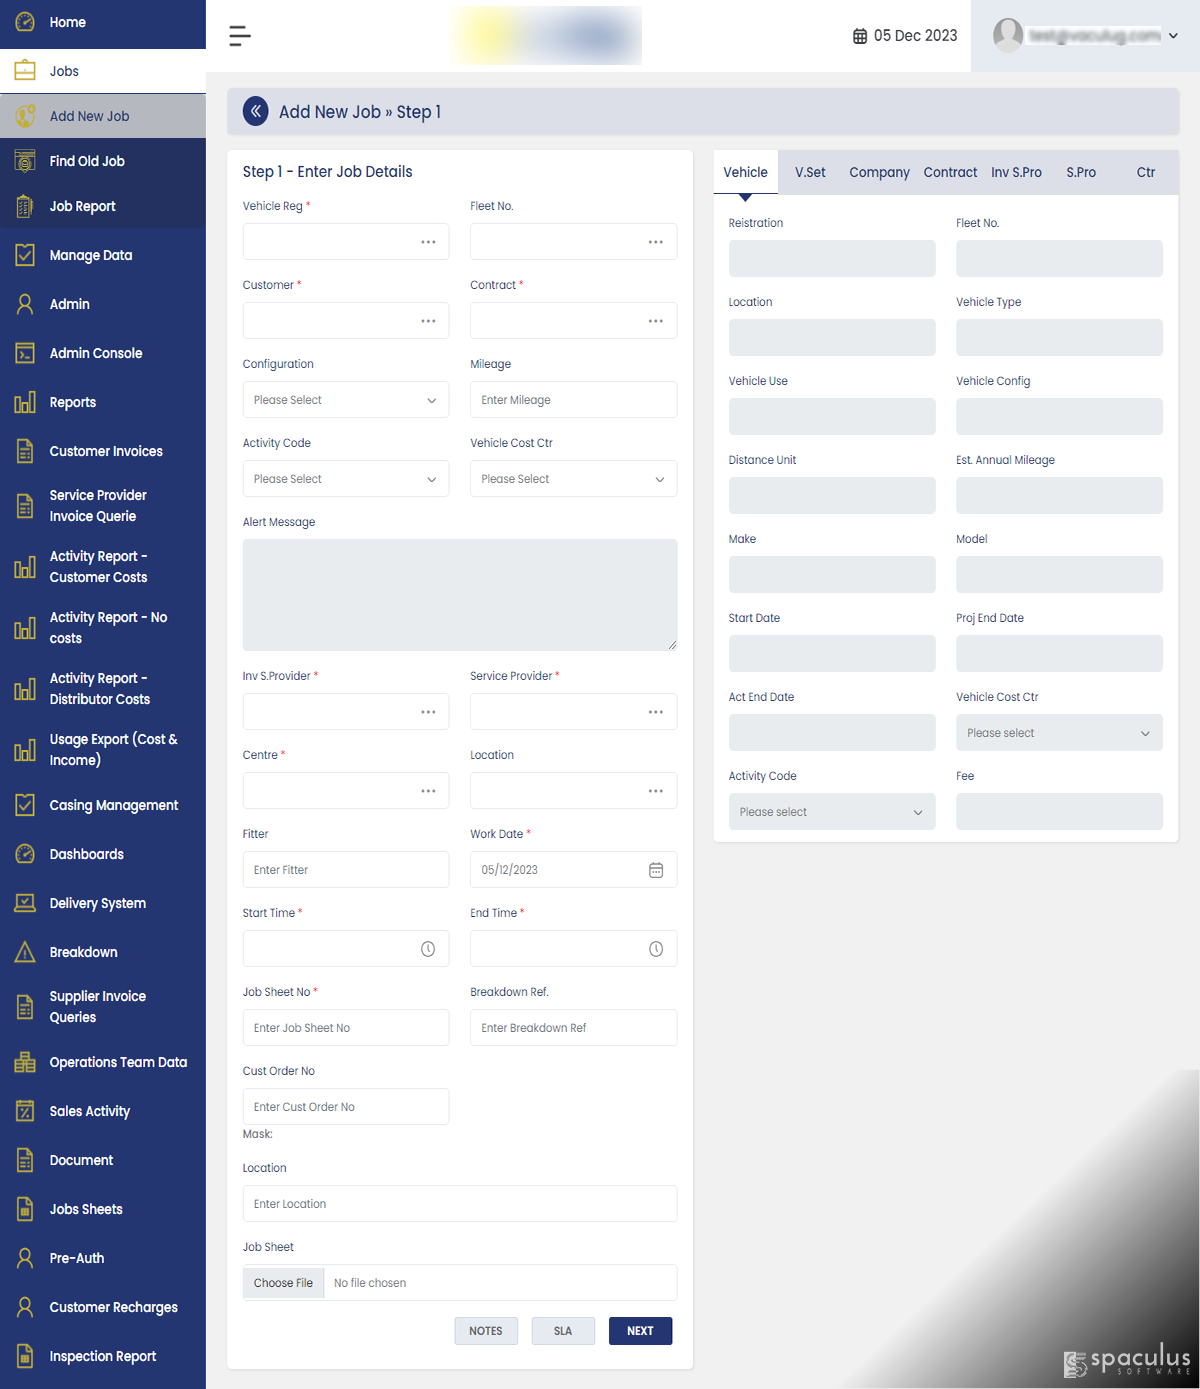
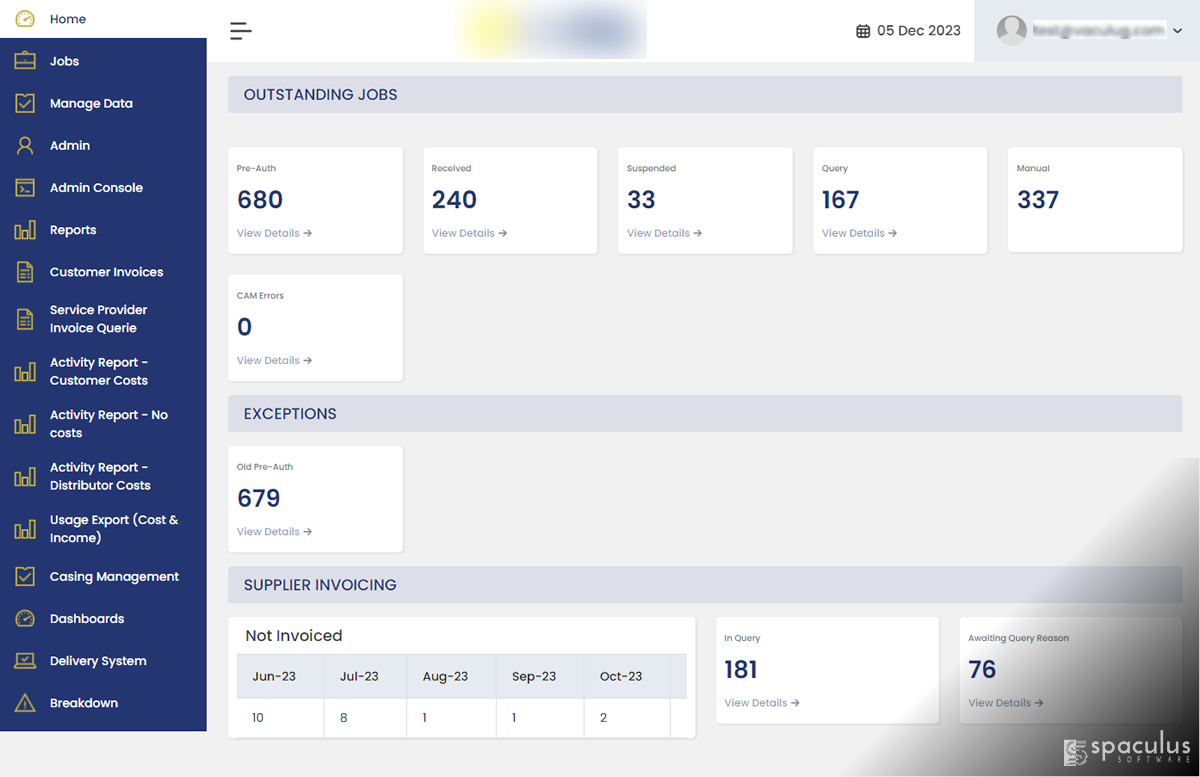
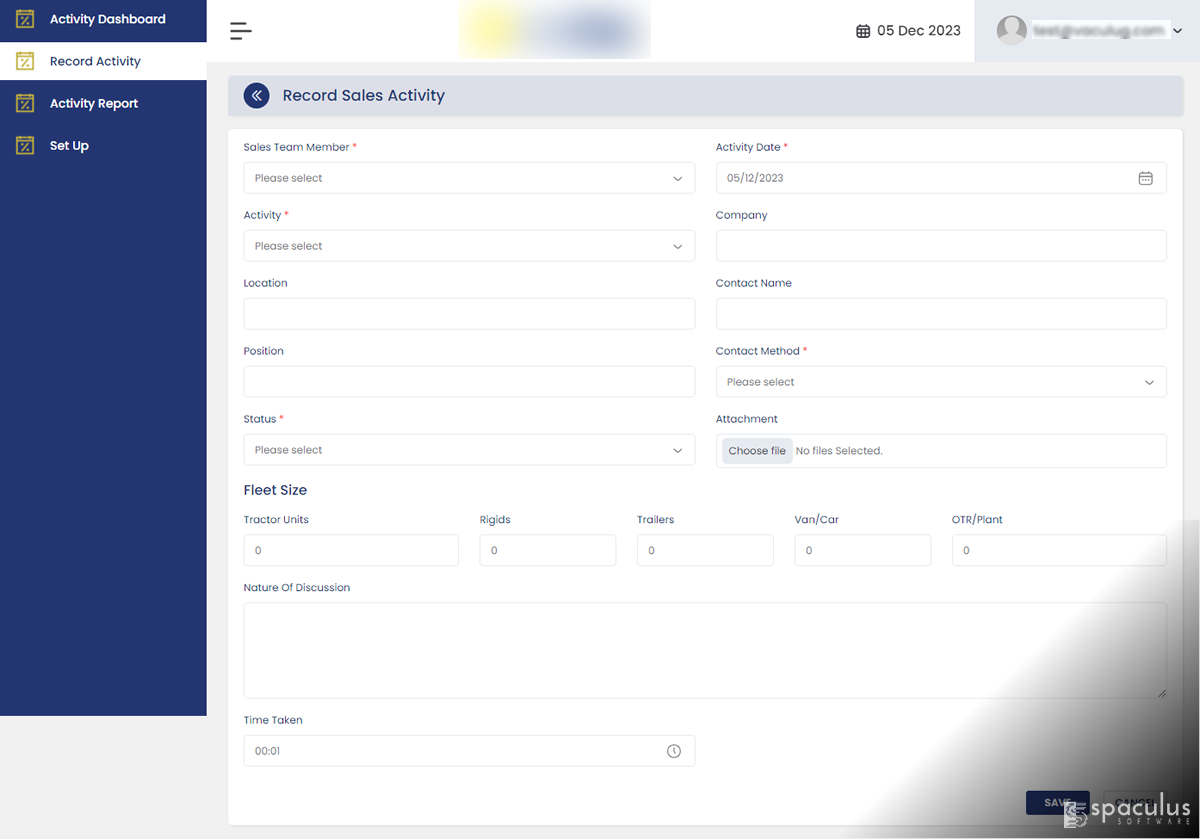
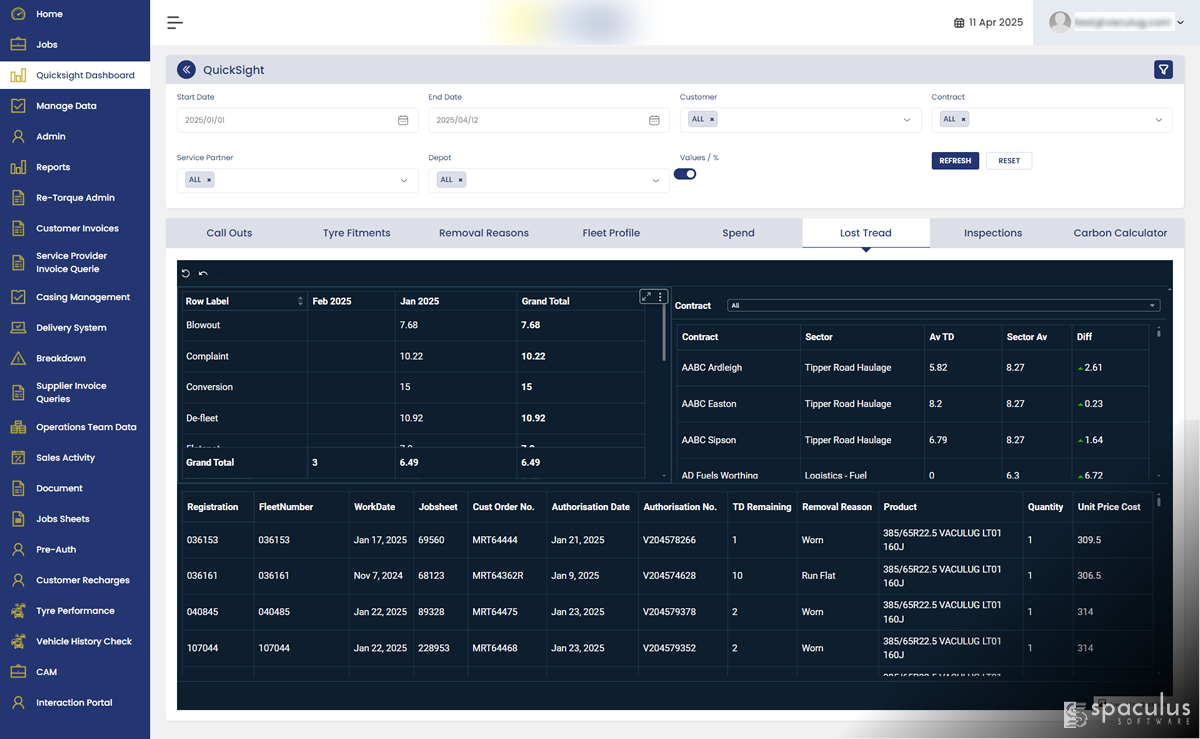
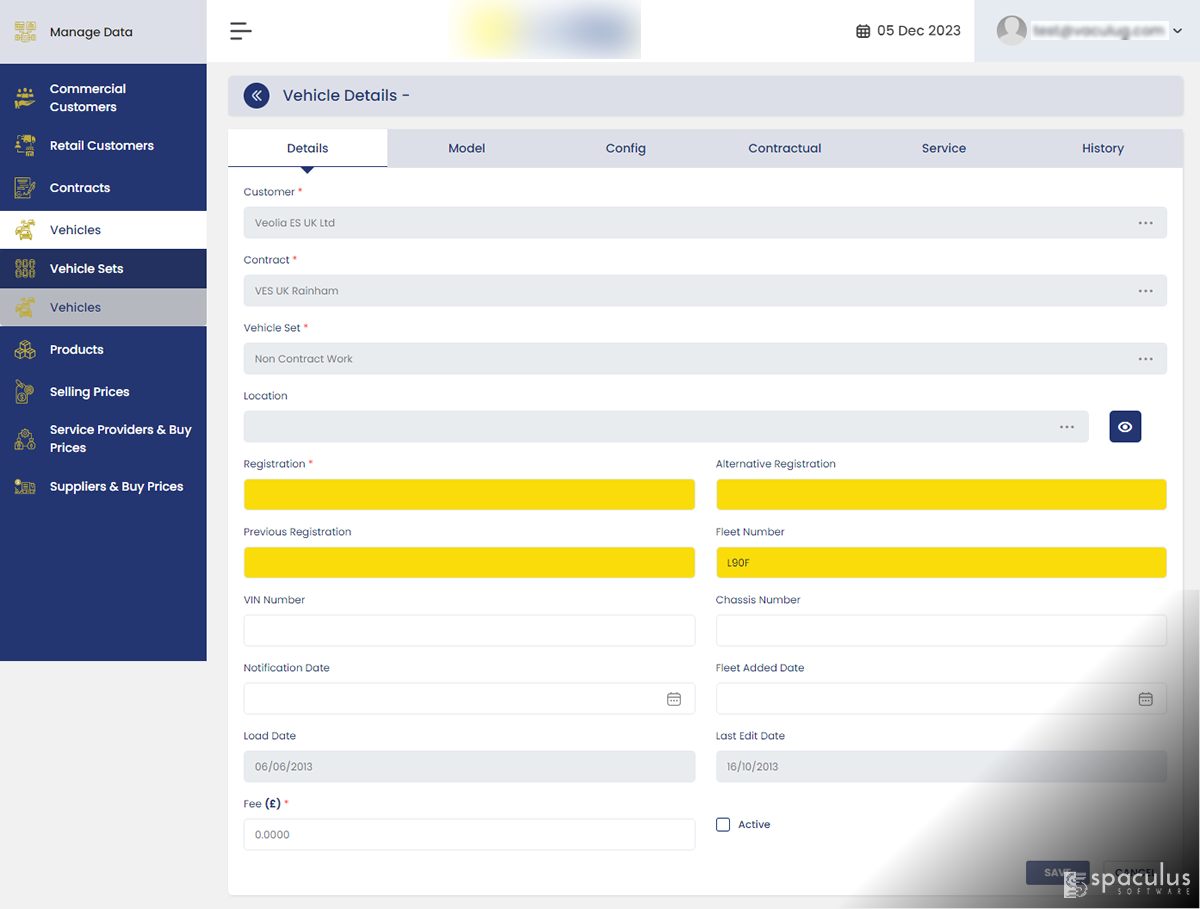
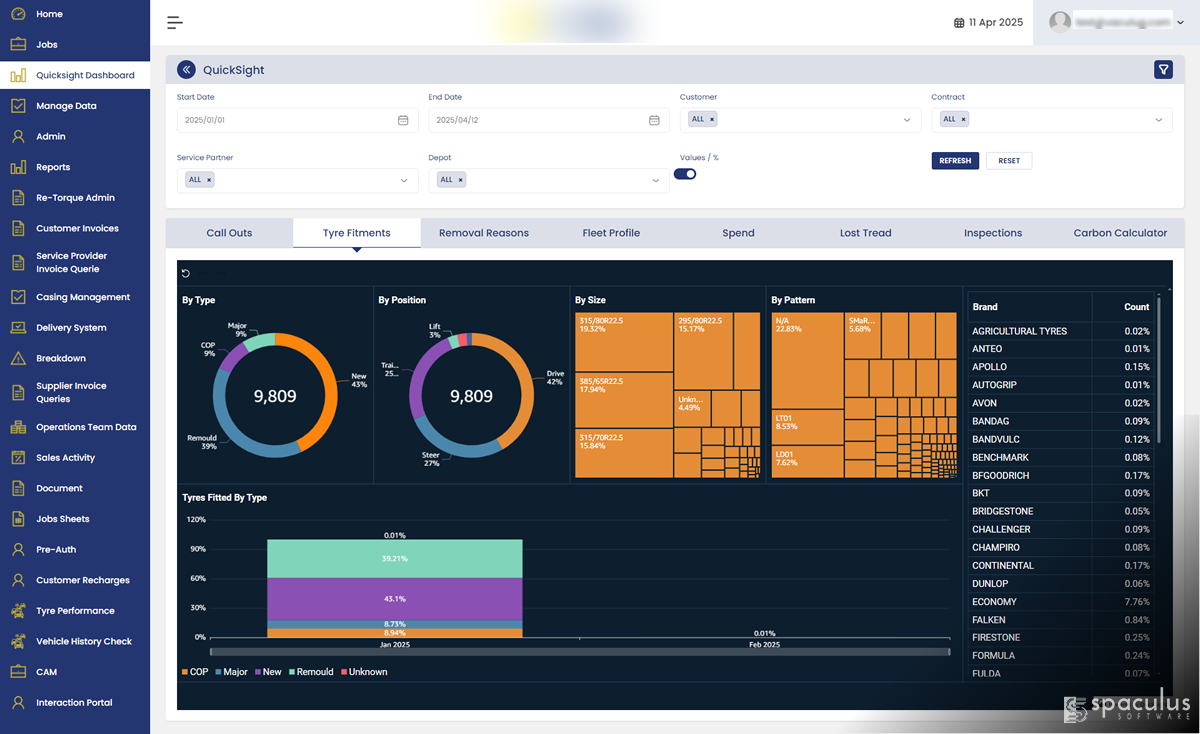
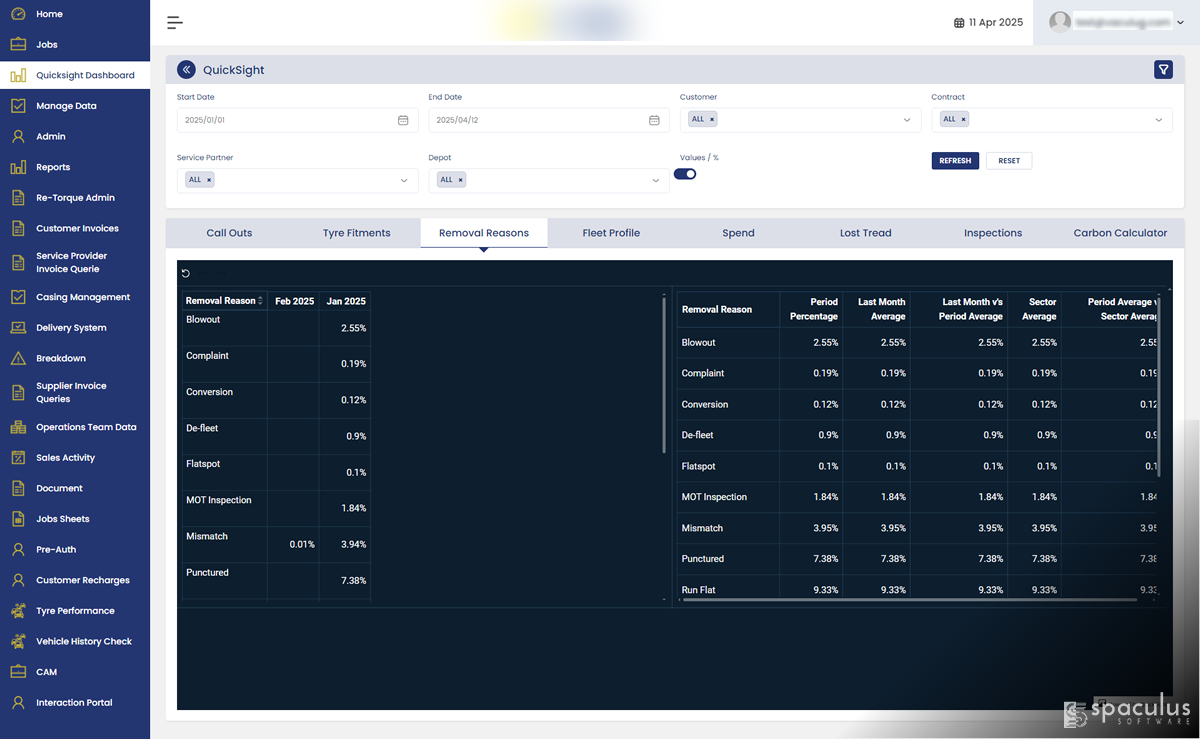
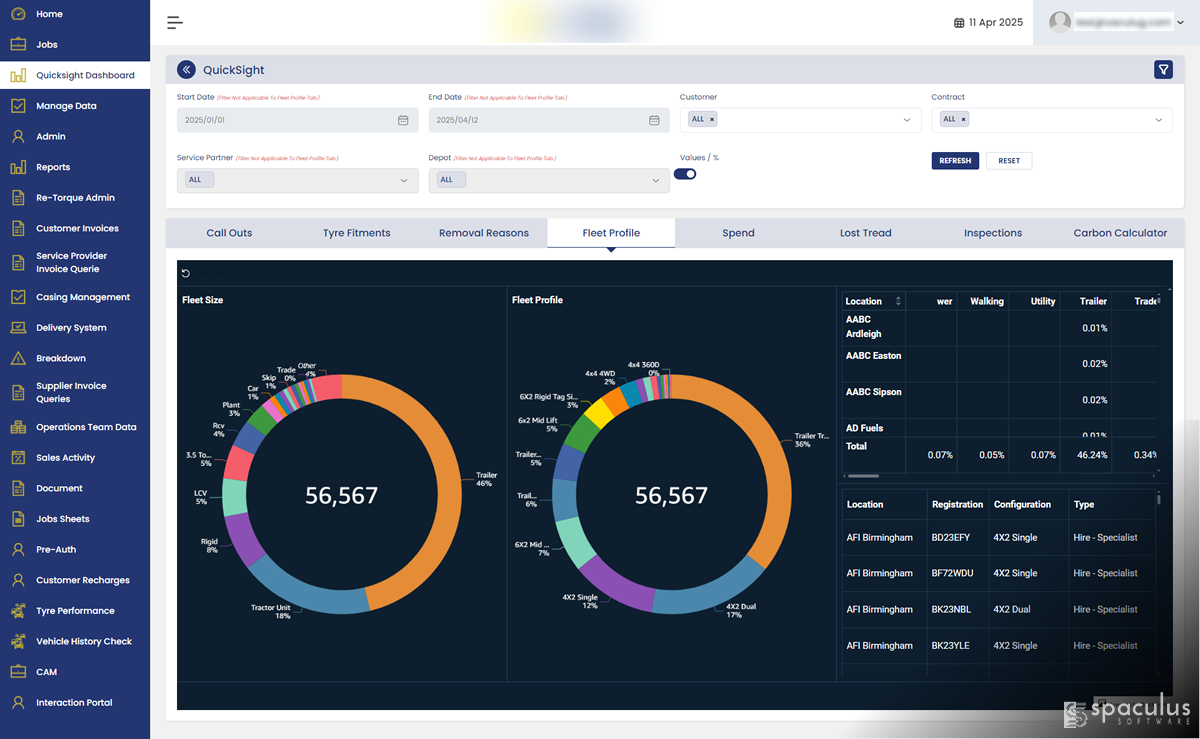
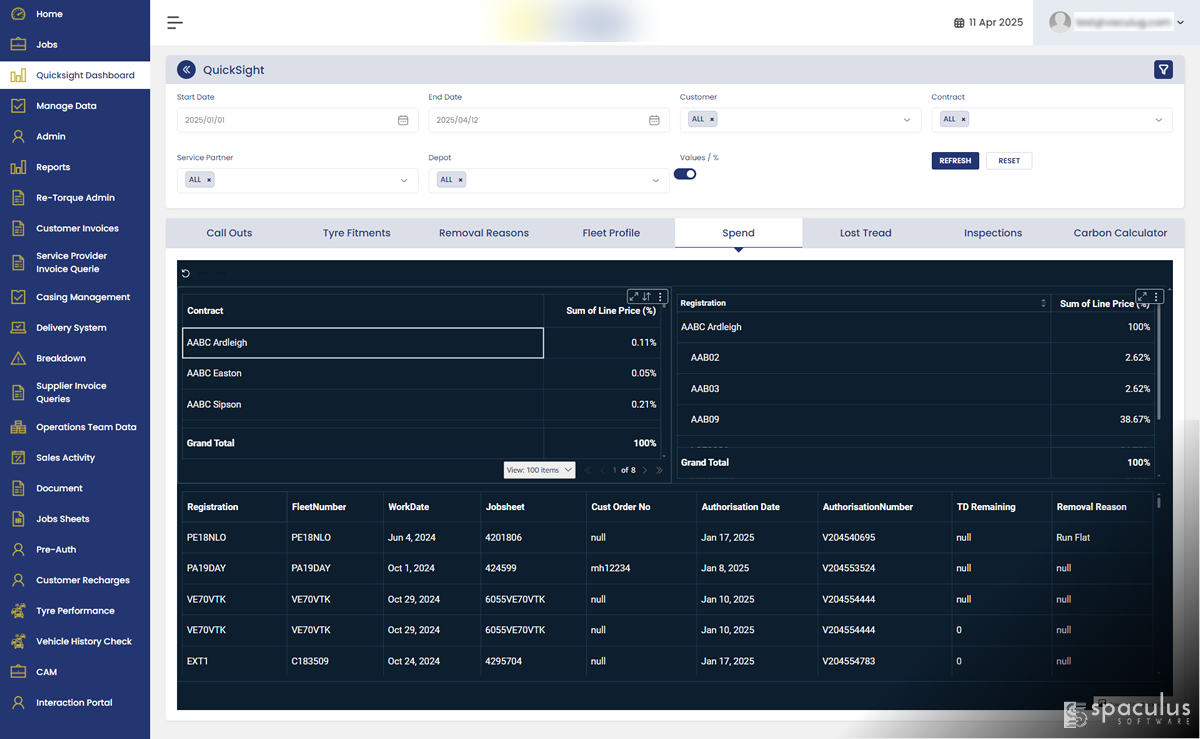
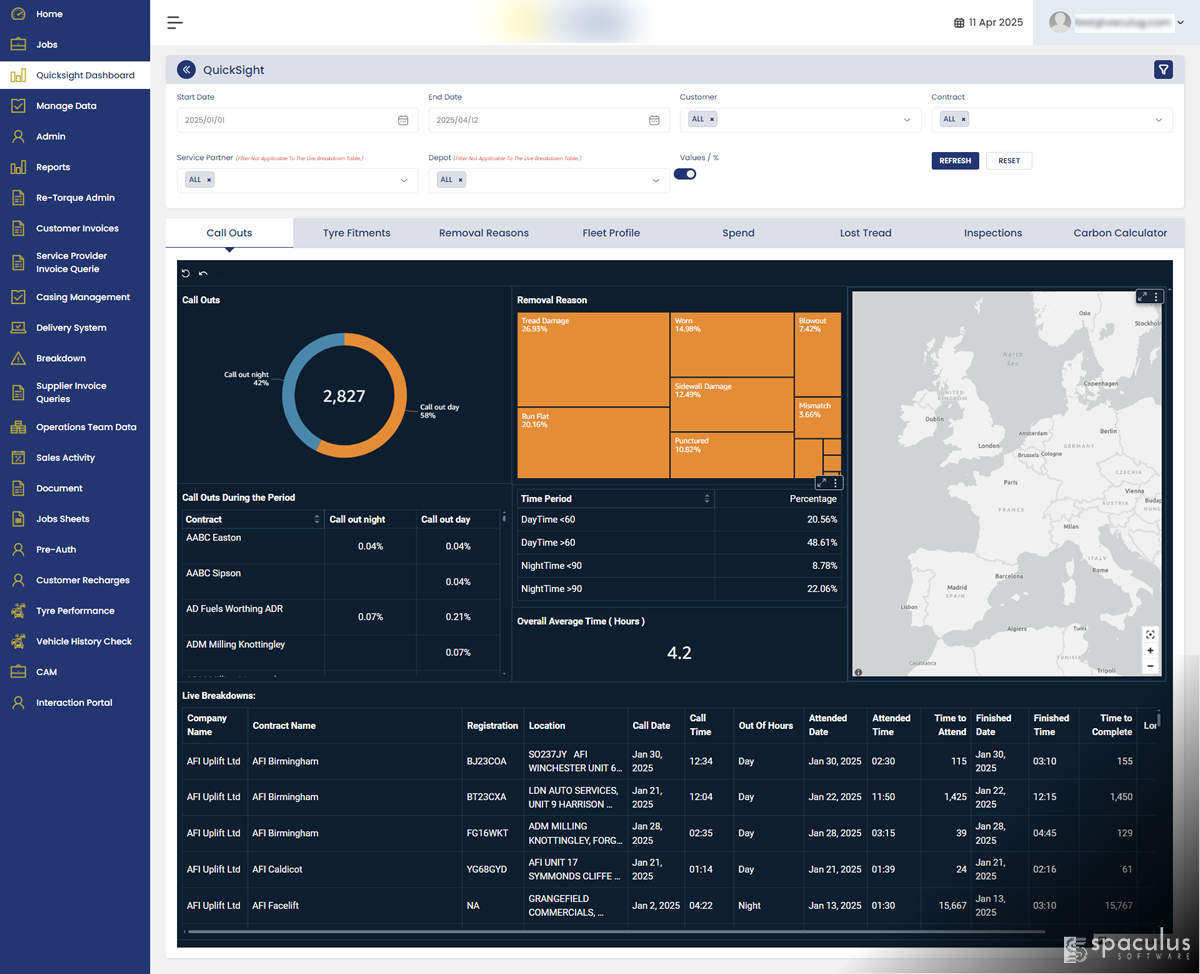
We built a dashboard system using Amazon QuickSight and SPICE that brings everything together in one place. It pulls data from their system, refreshes daily, and shows job progress in real-time — no coding or technical help required. Teams can filter, track, and forecast using a clean and simple interface.

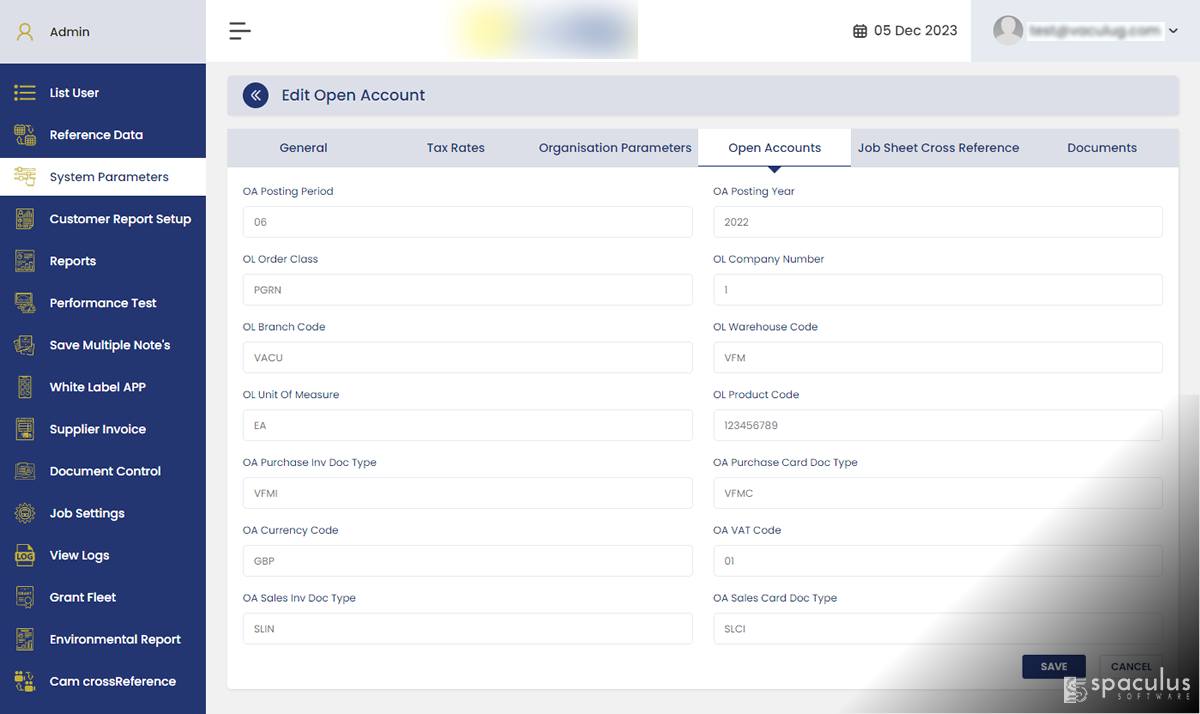
This setup helps every department work with the same data, plan better, and respond faster — without adding extra tools or workload.

Icon

Industry

Automobile

Icon

Region

UK

Technical Stack

image
image
image
image
image

Our Role

Icon

Development

Icon

Deployment

Project Highlights

  • Live Job Monitoring
    Gives real-time visibility into each job’s status. Teams can act quickly, avoid delays, and reduce update follow-ups.
  • AI Forecasting & Alerts
    Uses past data to predict spikes or slowdowns. Highlights unusual patterns for better planning and fewer surprises.
  • Simple Data Filtering (No Tech Help Needed)
    Filter job data easily with dropdowns—no SQL or developer help required.
  • Fast Performance with SPICE Engine
    Loads thousands of records in seconds with AWS SPICE. Fast, smooth performance—even during heavy use.
  • Auto-Sync with Daily Data Refresh
    Pulls fresh data from MySQL daily. No manual updates needed—teams always work with the latest info.
image
image
image
image
image
image
image
image
image
image

Project Screenshots

Get a Free Consultation Today!